PPG Beat Detection
Getting started with the PPG beat detectors.
Detecting beats in a PPG signal
This tutorial demonstrates how to detect beats in a PPG signal using algorithms in the toolbox.
- Download a minute of sample data.
- Load this data file into Matlab. The data in this file is contained within a structure named data, which contains PPG and other signals. The PPG data can be found at data.ppg (with the PPG signal given in two fields: v contains the PPG samples, and fs is the sampling frequency in Hz).
- Use the following Matlab commands to detect beats in the PPG (using the 'IMS' beat detector), and then plot the PPG signal and detected beats:
S = data.ppg;   % extract PPG data
beat_detector = 'IMS';     % Select Incremental-Merge Segmentation beat detector
[peaks, onsets, mid_amps] = detect_ppg_beats(S, beat_detector);     % detect beats in PPG

figure('Position', [20,20,1000,350])     % Setup figure
subplot('Position', [0.05,0.17,0.92,0.82])
t = [0:length(S.v)-1]/S.fs;             % Make time vector
plot(t, S.v, 'b'), hold on,             % Plot PPG signal
plot(t(peaks), S.v(peaks), 'or'),       % Plot detected beats
ftsize = 20;                            % Tidy up plot
set(gca, 'FontSize', ftsize, 'YTick', [], 'Box', 'off');
ylabel('PPG', 'FontSize', ftsize),
xlabel('Time (s)', 'FontSize', ftsize)
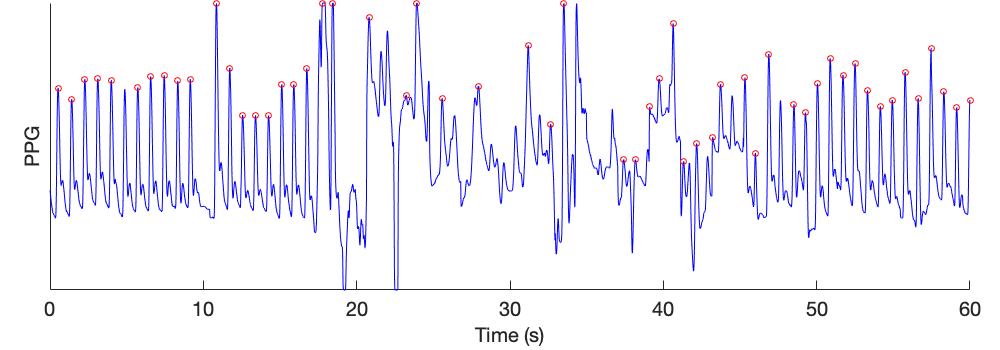
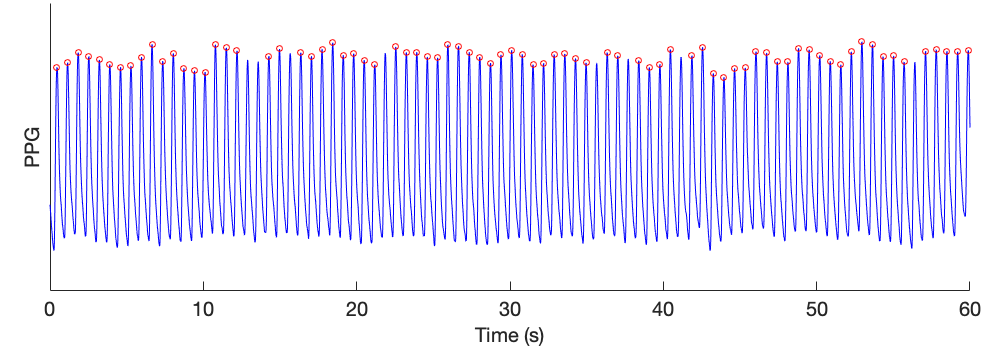
This results in the following detected beats:
This tutorial is demonstrated in the following video:
Detecting beats in different types of signals
- Download a minute of sample data, choosing from: normal data, neonatal data, atrial fibrillation data, or noisy data.
- Load this data file into Matlab. The data in this file is contained within a structure named data, which contains PPG and other signals. The PPG data can be found at data.ppg (with the PPG signal given in two fields: v contains the PPG samples, and fs is the sampling frequency in Hz).
- Use the following Matlab commands to detect beats in the PPG (using the 'IMS' beat detector), and then plot the PPG signal and detected beats:
S = data.ppg;   % extract PPG data
beat_detector = 'IMS';     % Select Incremental-Merge Segmentation beat detector
[peaks, onsets, mid_amps] = detect_ppg_beats(S, beat_detector);     % detect beats in PPG

figure('Position', [20,20,1000,350])     % Setup figure
subplot('Position', [0.05,0.17,0.92,0.82])
t = [0:length(S.v)-1]/S.fs;             % Make time vector
plot(t, S.v, 'b'), hold on,             % Plot PPG signal
plot(t(peaks), S.v(peaks), 'or'),       % Plot detected beats
ftsize = 20;                            % Tidy up plot
set(gca, 'FontSize', ftsize, 'YTick', [], 'Box', 'off');
ylabel('PPG', 'FontSize', ftsize),
xlabel('Time (s)', 'FontSize', ftsize)
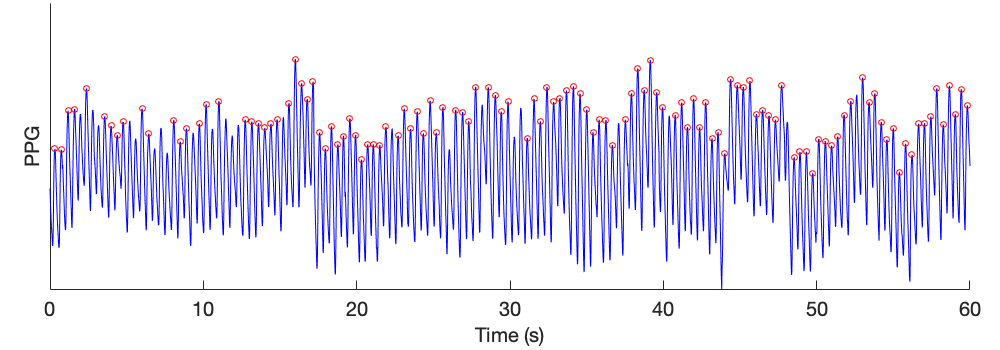
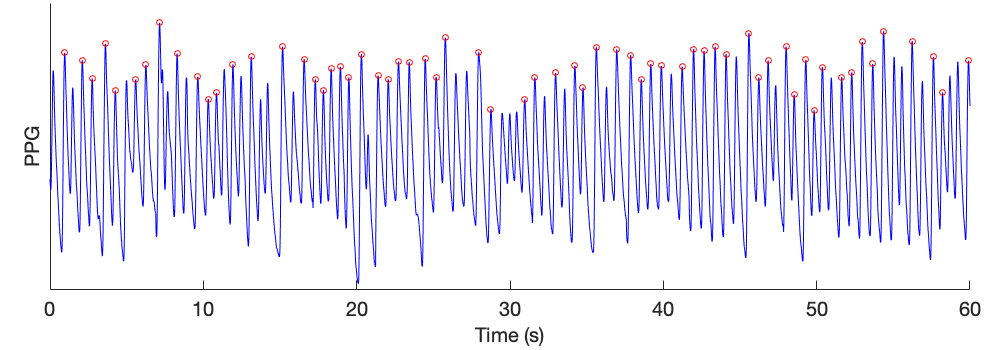
This results in the following detected beats:
Neonatal data
Atrial fibrillation data
Noisy data